- Transcriptomics Data Analysis
Petr V. Nazarov, LIH
2017-05-31
rm(list=ls())

Meta = read.table("http://edu.sablab.net/data/gz/Affymetrix_miRNA2.txt",sep="\t",header=T,as.is=T)
Data = read.table("http://edu.sablab.net/data/gz/rma-sketch.summary.txt",sep="\t",header=T,as.is=T)

str(Meta)
## 'data.frame': 18 obs. of 4 variables:
## $ cel_files: chr "array_01.cel" "array_02.cel" "array_03.cel" "array_04.cel" ...
## $ name : chr "T000.1" "T000.2" "T005.1" "T005.2" ...
## $ time : num 0 0 0.5 0.5 3 3 6 6 12 12 ...
## $ replicate: int 1 2 1 2 1 2 1 2 1 2 ...str(Data)## 'data.frame': 20706 obs. of 19 variables:
## $ probeset_id : chr "AFFX-BioB-5_at" "AFFX-BioB-M_at" "AFFX-BioB-3_at" "AFFX-BioC-5_at" ...
## $ array_01.cel: num 10.2 11 11.1 12 10.9 ...
## $ array_02.cel: num 10.3 11 11.2 12 11 ...
## $ array_03.cel: num 10.5 11.2 11.4 12.2 11.2 ...
## $ array_04.cel: num 10.3 10.8 11.1 11.9 10.8 ...
## $ array_05.cel: num 10.4 11.1 11.3 12.1 11 ...
## $ array_06.cel: num 10.3 11 11.2 12 10.9 ...
## $ array_07.cel: num 10.4 11.2 11.3 12.1 11.1 ...
## $ array_08.cel: num 10.8 11.5 11.6 12.5 11.3 ...
## $ array_09.cel: num 10.1 10.9 11.1 11.8 10.8 ...
## $ array_10.cel: num 10.5 11.2 11.4 12.2 11.1 ...
## $ array_11.cel: num 10.3 11 11.2 12 11 ...
## $ array_12.cel: num 10.2 11 11.2 12 11 ...
## $ array_13.cel: num 10.6 11.1 11.3 12.3 11.2 ...
## $ array_14.cel: num 10.5 11.2 11.5 12.3 11.2 ...
## $ array_15.cel: num 10.2 11 11.1 12 10.9 ...
## $ array_16.cel: num 10.3 11.1 11.3 12.2 11.1 ...
## $ array_17.cel: num 10.2 10.8 11.1 12 10.9 ...
## $ array_18.cel: num 10.2 10.8 11 11.9 10.8 ...# keep only mature miRNA
idx.hsa = grep("^hsa-", Data$probeset_id)
X = as.matrix(Data[idx.hsa,-1])
rownames(X) = Data[idx.hsa,1]
group = factor(sub("[.].+","",Meta$name))
color = rainbow(10)[as.integer(group)]
## see data distribution
plot(density(X),lwd=2)
for (i in 1:ncol(X)) lines(density(X[,i]),col=color[i])
abline(v=5,col="green")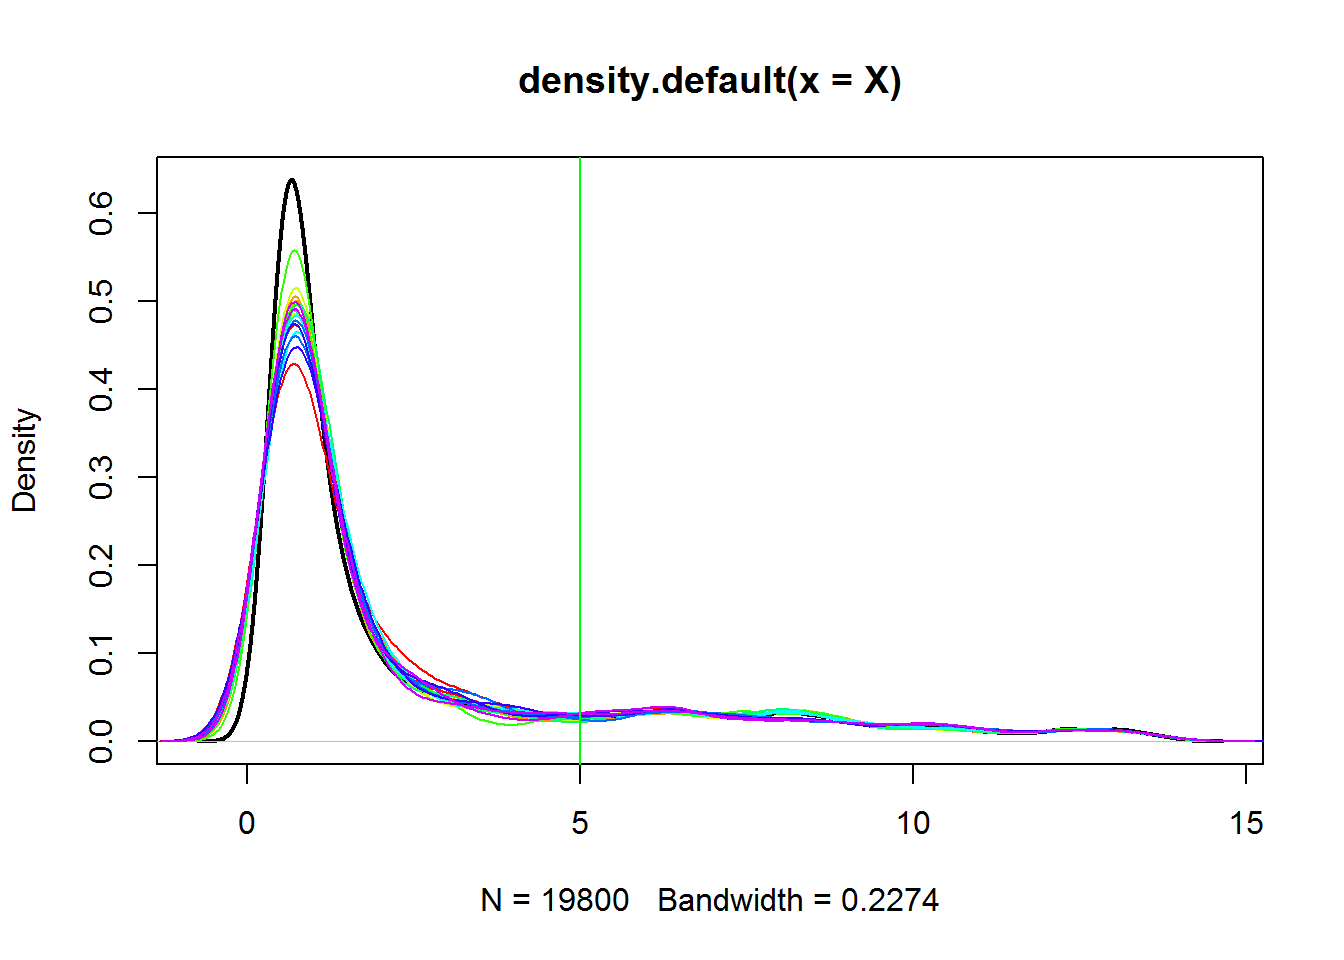
## how many genes are expressed?
idx.expr = apply(X,1,max)>5
sum(idx.expr)
## [1] 239## let's filter out non-expressed
X = X[idx.expr,]
## perform PCA
PC = prcomp(t(X))
str(PC)## List of 5
## $ sdev : num [1:18] 8.09 2.21 2.07 1.87 1.62 ...
## $ rotation: num [1:239, 1:18] -0.00417 -0.16943 0.00519 -0.00503 -0.01591 ...
## ..- attr(*, "dimnames")=List of 2
## .. ..$ : chr [1:239] "hsa-let-7a_st" "hsa-let-7a-2-star_st" "hsa-let-7b_st" "hsa-let-7c_st" ...
## .. ..$ : chr [1:18] "PC1" "PC2" "PC3" "PC4" ...
## $ center : Named num [1:239] 13.17 4.48 12.5 11.54 11 ...
## ..- attr(*, "names")= chr [1:239] "hsa-let-7a_st" "hsa-let-7a-2-star_st" "hsa-let-7b_st" "hsa-let-7c_st" ...
## $ scale : logi FALSE
## $ x : num [1:18, 1:18] -5.16 -5.85 -5.8 -5.76 -5.31 ...
## ..- attr(*, "dimnames")=List of 2
## .. ..$ : chr [1:18] "array_01.cel" "array_02.cel" "array_03.cel" "array_04.cel" ...
## .. ..$ : chr [1:18] "PC1" "PC2" "PC3" "PC4" ...
## - attr(*, "class")= chr "prcomp"plot(PC$x[,1],PC$x[,2],col=color,cex=2,pch=19)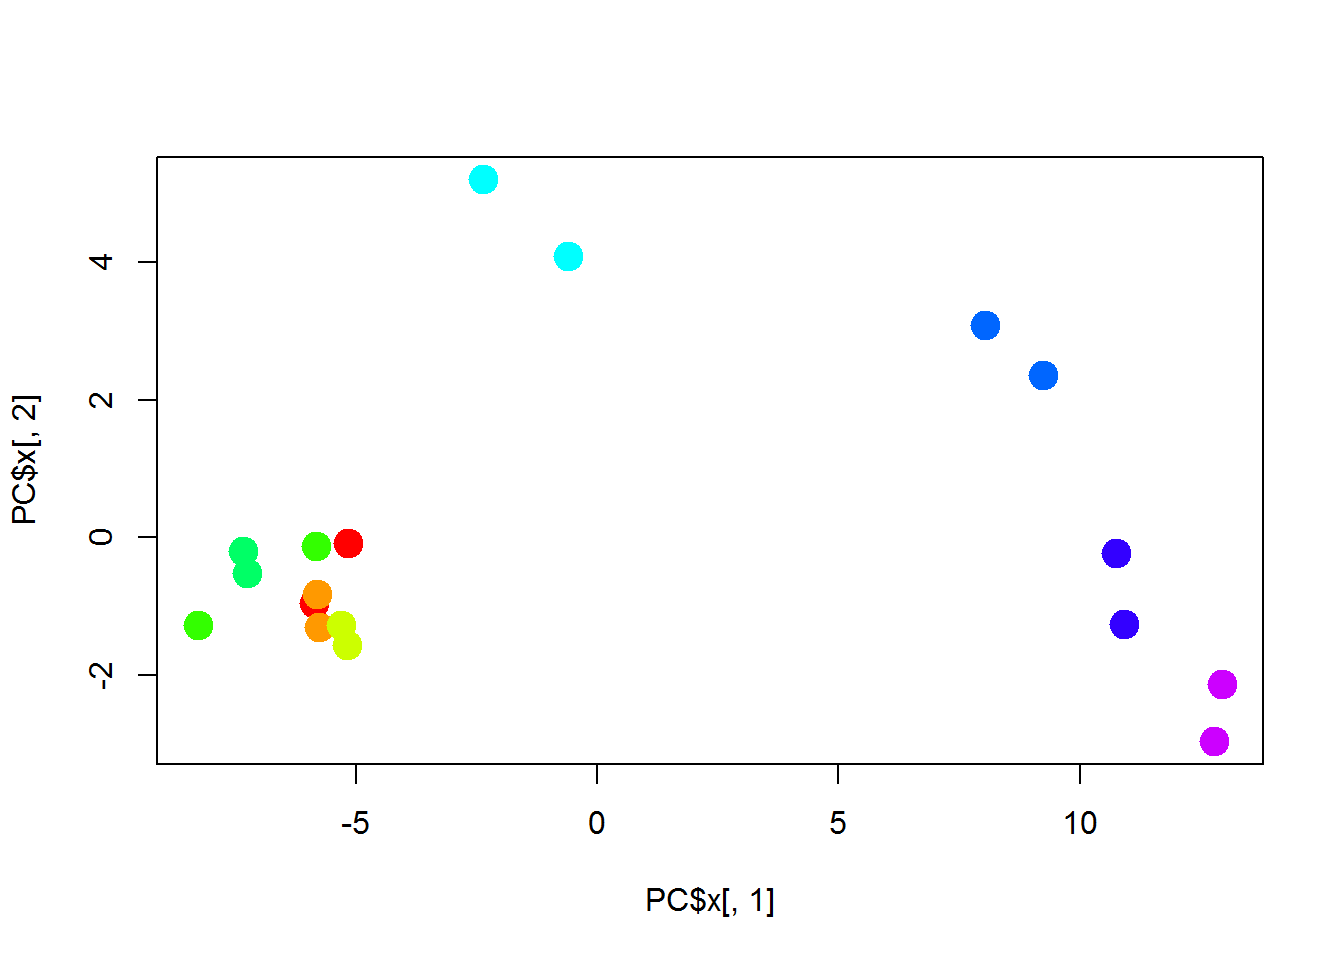
## perform DEA
library(limma)
design=model.matrix(~ -1 + group)
str(design)
## num [1:18, 1:9] 1 1 0 0 0 0 0 0 0 0 ...
## - attr(*, "dimnames")=List of 2
## ..$ : chr [1:18] "1" "2" "3" "4" ...
## ..$ : chr [1:9] "groupT000" "groupT005" "groupT03" "groupT06" ...
## - attr(*, "assign")= int [1:9] 1 1 1 1 1 1 1 1 1
## - attr(*, "contrasts")=List of 1
## ..$ group: chr "contr.treatment"colnames(design)=sub("group","",colnames(design))
fit = lmFit(X,design=design)
contrast.matrix=makeContrasts(T24-T000, T48-T000, T72-T000, levels=design)
fit2 = contrasts.fit(fit,contrast.matrix)
EB = eBayes(fit2)
TopGeneTable = topTable(EB,number=nrow(X),adjust="BH")
str(TopGeneTable)## 'data.frame': 239 obs. of 7 variables:
## $ T24...T000: num 0.703 1.393 2.1 -0.786 -0.355 ...
## $ T48...T000: num 2.04 2.76 2.16 -1.67 1.53 ...
## $ T72...T000: num 3.12 3.13 2.25 -2 1.27 ...
## $ AveExpr : num 8.28 8.15 9.02 9.49 9.15 ...
## $ F : num 255 227 222 209 178 ...
## $ P.Value : num 2.80e-10 5.20e-10 5.87e-10 8.06e-10 1.87e-09 ...
## $ adj.P.Val : num 4.67e-08 4.67e-08 4.67e-08 4.81e-08 8.93e-08 ...##now lets see for each pair
Res24 = topTable(EB,
coef="T24 - T000",
number=nrow(X),
adjust="BH",
sort.by="none",
genelist=row.names(X))
idx = (TopGeneTable$adj.P.Val < 0.05)
heatmap(t(scale(t(X[idx,]))),
Colv = NA,
ColSideColors=color,
scale="none",
col = colorRampPalette (c("blue","wheat","red"))(1000))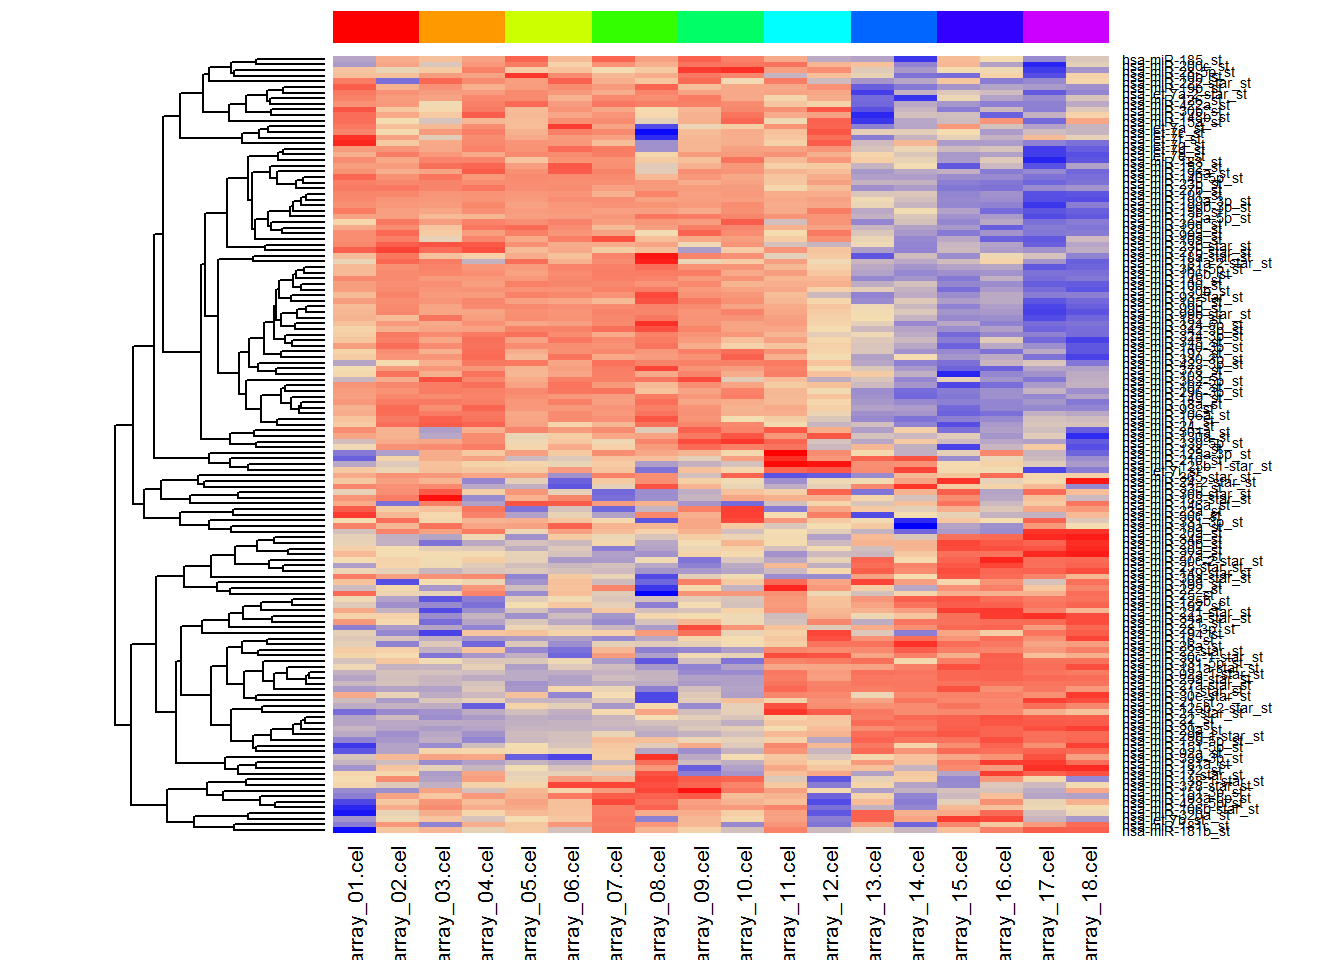
Exercise 6.1
Load raw Affy data from http://edu.sablab.net/data/gz/interferon.zip
Try to import the data usingoligopackage.
Import sample data
Investigate the data by PCA
(optional) annotate genes using ensembl/biomaRT
Find differentially expressed genes using
limmapackageMake a heatmap of significant genes
rm(list=ls())
setwd("D:/Data/cel")
library(oligo)
## Loading required package: BiocGenerics## Loading required package: parallel##
## Attaching package: 'BiocGenerics'## The following objects are masked from 'package:parallel':
##
## clusterApply, clusterApplyLB, clusterCall, clusterEvalQ,
## clusterExport, clusterMap, parApply, parCapply, parLapply,
## parLapplyLB, parRapply, parSapply, parSapplyLB## The following object is masked from 'package:limma':
##
## plotMA## The following objects are masked from 'package:stats':
##
## IQR, mad, xtabs## The following objects are masked from 'package:base':
##
## anyDuplicated, append, as.data.frame, cbind, colnames,
## do.call, duplicated, eval, evalq, Filter, Find, get, grep,
## grepl, intersect, is.unsorted, lapply, lengths, Map, mapply,
## match, mget, order, paste, pmax, pmax.int, pmin, pmin.int,
## Position, rank, rbind, Reduce, rownames, sapply, setdiff,
## sort, table, tapply, union, unique, unsplit, which, which.max,
## which.min## Loading required package: oligoClasses## Welcome to oligoClasses version 1.36.0## Loading required package: Biobase## Welcome to Bioconductor
##
## Vignettes contain introductory material; view with
## 'browseVignettes()'. To cite Bioconductor, see
## 'citation("Biobase")', and for packages 'citation("pkgname")'.## Loading required package: Biostrings## Loading required package: S4Vectors## Loading required package: stats4##
## Attaching package: 'S4Vectors'## The following object is masked from 'package:gplots':
##
## space## The following object is masked from 'package:caTools':
##
## runmean## The following objects are masked from 'package:reshape':
##
## expand, rename## The following objects are masked from 'package:base':
##
## colMeans, colSums, expand.grid, rowMeans, rowSums## Loading required package: IRanges## Loading required package: XVector## ===========================================================================## Welcome to oligo version 1.38.0## ===========================================================================##
## Attaching package: 'oligo'## The following object is masked from 'package:limma':
##
## backgroundCorrectcelFiles = list.celfiles(full.names=TRUE)
rawData = read.celfiles(celFiles)## Loading required package: pd.hugene.1.0.st.v1## Loading required package: RSQLite## Loading required package: DBI## Platform design info loaded.## Reading in : ./Ctrl-1.CEL
## Reading in : ./Ctrl-2.CEL
## Reading in : ./J72h-1.CEL
## Reading in : ./J72h-2.CEL
## Reading in : ./T03h-1.CEL
## Reading in : ./T03h-2.CEL
## Reading in : ./T12h-1.CEL
## Reading in : ./T12h-2.CEL
## Reading in : ./T24h-1.CEL
## Reading in : ./T24h-2.CEL
## Reading in : ./T24h-3.CEL
## Reading in : ./T48h-1.CEL
## Reading in : ./T48h-2.CEL
## Reading in : ./T48h-3.CEL
## Reading in : ./T72h-1.CEL
## Reading in : ./T72h-2.CEL
## Reading in : ./T72h-3.CELstr(rawData)## Formal class 'GeneFeatureSet' [package "oligoClasses"] with 9 slots
## ..@ manufacturer : chr "Affymetrix"
## ..@ intensityFile : chr NA
## ..@ assayData :<environment: 0x000000005b90e698>
## ..@ phenoData :Formal class 'AnnotatedDataFrame' [package "Biobase"] with 4 slots
## .. .. ..@ varMetadata :'data.frame': 1 obs. of 2 variables:
## .. .. .. ..$ labelDescription: chr "Index"
## .. .. .. ..$ channel : Factor w/ 2 levels "exprs","_ALL_": 2
## .. .. ..@ data :'data.frame': 17 obs. of 1 variable:
## .. .. .. ..$ index: int [1:17] 1 2 3 4 5 6 7 8 9 10 ...
## .. .. ..@ dimLabels : chr [1:2] "rowNames" "columnNames"
## .. .. ..@ .__classVersion__:Formal class 'Versions' [package "Biobase"] with 1 slot
## .. .. .. .. ..@ .Data:List of 1
## .. .. .. .. .. ..$ : int [1:3] 1 1 0
## ..@ featureData :Formal class 'AnnotatedDataFrame' [package "Biobase"] with 4 slots
## .. .. ..@ varMetadata :'data.frame': 0 obs. of 1 variable:
## .. .. .. ..$ labelDescription: chr(0)
## .. .. ..@ data :'data.frame': 1102500 obs. of 0 variables
## .. .. ..@ dimLabels : chr [1:2] "featureNames" "featureColumns"
## .. .. ..@ .__classVersion__:Formal class 'Versions' [package "Biobase"] with 1 slot
## .. .. .. .. ..@ .Data:List of 1
## .. .. .. .. .. ..$ : int [1:3] 1 1 0
## ..@ experimentData :Formal class 'MIAME' [package "Biobase"] with 13 slots
## .. .. ..@ name : chr ""
## .. .. ..@ lab : chr ""
## .. .. ..@ contact : chr ""
## .. .. ..@ title : chr ""
## .. .. ..@ abstract : chr ""
## .. .. ..@ url : chr ""
## .. .. ..@ pubMedIds : chr ""
## .. .. ..@ samples : list()
## .. .. ..@ hybridizations : list()
## .. .. ..@ normControls : list()
## .. .. ..@ preprocessing : list()
## .. .. ..@ other : list()
## .. .. ..@ .__classVersion__:Formal class 'Versions' [package "Biobase"] with 1 slot
## .. .. .. .. ..@ .Data:List of 2
## .. .. .. .. .. ..$ : int [1:3] 1 0 0
## .. .. .. .. .. ..$ : int [1:3] 1 1 0
## ..@ annotation : chr "pd.hugene.1.0.st.v1"
## ..@ protocolData :Formal class 'AnnotatedDataFrame' [package "Biobase"] with 4 slots
## .. .. ..@ varMetadata :'data.frame': 2 obs. of 2 variables:
## .. .. .. ..$ labelDescription: chr [1:2] "Names of files used in 'exprs'" "Run dates for files used in 'exprs'"
## .. .. .. ..$ channel : Factor w/ 2 levels "exprs","_ALL_": 2 2
## .. .. ..@ data :'data.frame': 17 obs. of 2 variables:
## .. .. .. ..$ exprs: Factor w/ 17 levels "./Ctrl-1.CEL",..: 1 2 3 4 5 6 7 8 9 10 ...
## .. .. .. ..$ dates: Factor w/ 17 levels "2011-10-07T11:25:12Z",..: 1 3 14 15 4 2 17 16 9 10 ...
## .. .. ..@ dimLabels : chr [1:2] "rowNames" "columnNames"
## .. .. ..@ .__classVersion__:Formal class 'Versions' [package "Biobase"] with 1 slot
## .. .. .. .. ..@ .Data:List of 1
## .. .. .. .. .. ..$ : int [1:3] 1 1 0
## ..@ .__classVersion__:Formal class 'Versions' [package "Biobase"] with 1 slot
## .. .. ..@ .Data:List of 4
## .. .. .. ..$ : int [1:3] 3 3 1
## .. .. .. ..$ : int [1:3] 2 34 0
## .. .. .. ..$ : int [1:3] 1 3 0
## .. .. .. ..$ : int [1:3] 1 0 0sNames = sampleNames(rawData)
Meta = read.table("sampleAnno.txt",header=TRUE,sep="\t",row.names=1)
Meta = Meta[sNames,]
MAplot(rawData[, c(1,2,9,10)], pairs=TRUE)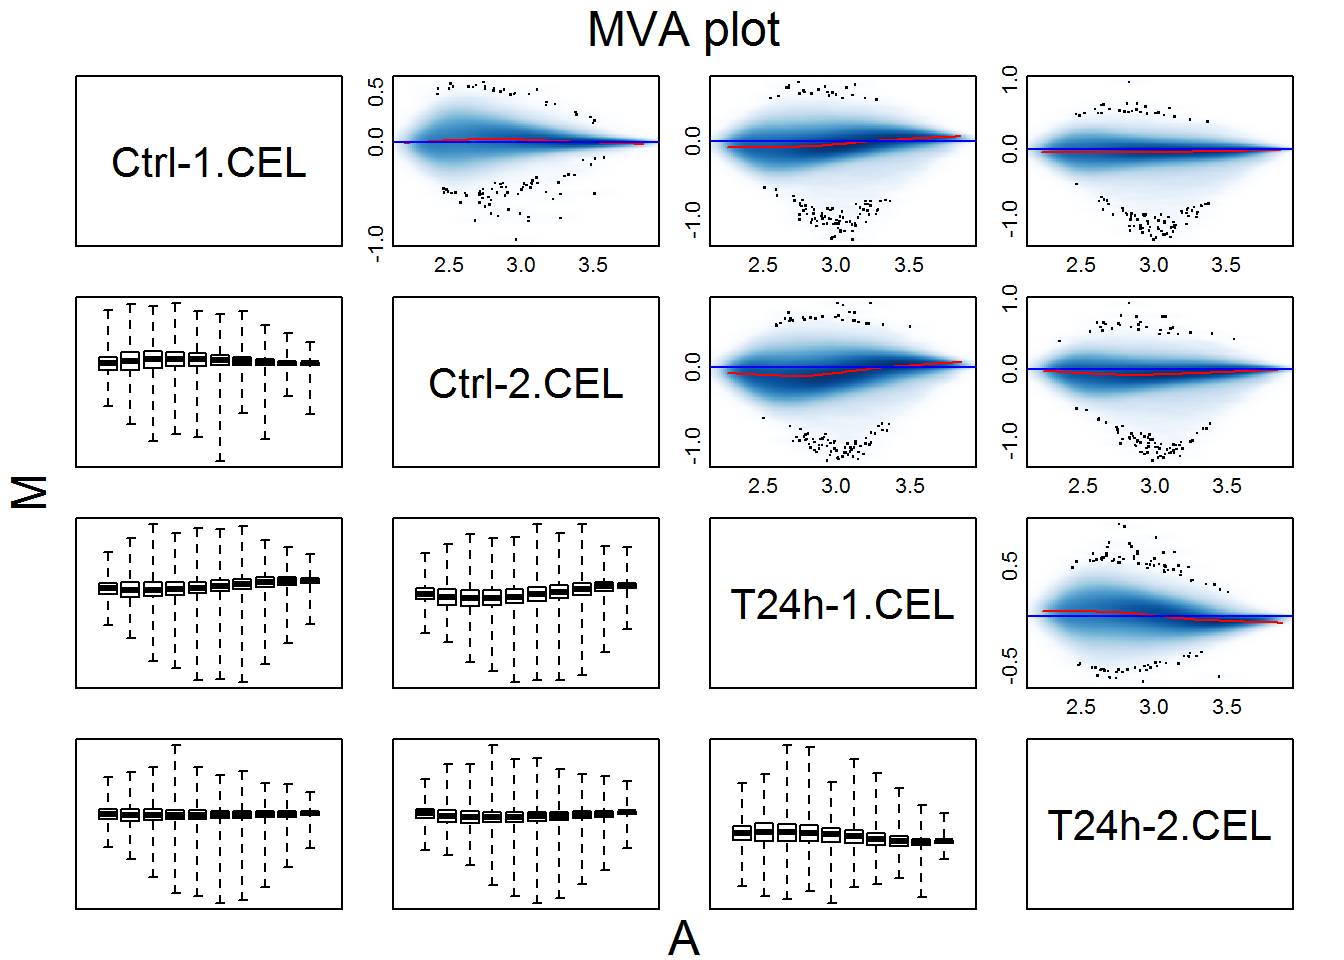
## normalizazation and summarization
eset = rma(rawData)
## Background correcting
## Normalizing
## Calculating ExpressionX = exprs(eset)
## annotation from http://www.ensembl.org/biomart
Anno = read.table("mart_export.txt",header = TRUE, sep="\t", quote="\"",comment.char="",as.is=TRUE)
Anno$AFFY.HuGene.1.0.st.v1.probe = as.character(Anno$AFFY.HuGene.1.0.st.v1.probe)
Anno = Anno[!is.na(Anno$AFFY.HuGene.1.0.st.v1.probe),]
## clean annotation even more
ikeep = Anno$Transcript.type == "protein_coding" &
Anno$AFFY.HuGene.1.0.st.v1.probe %in% rownames(X) &
!duplicated(Anno$AFFY.HuGene.1.0.st.v1.probe)
Anno = Anno[ikeep,]
rownames(Anno) = Anno$AFFY.HuGene.1.0.st.v1.probe
str(Anno)## 'data.frame': 18254 obs. of 10 variables:
## $ Gene.stable.ID : chr "ENSG00000185222" "ENSG00000277196" "ENSG00000141252" "ENSG00000141252" ...
## $ AFFY.HuGene.1.0.st.v1.probe: chr "8169022" "8074335" "8010924" "8010918" ...
## $ Strand : int 1 -1 -1 -1 1 1 1 1 -1 1 ...
## $ Chromosome.scaffold.name : chr "X" "KI270734.1" "17" "17" ...
## $ Gene.Start..bp. : int 103356452 138082 508668 508668 137526 137526 129434433 129434433 229516582 65615773 ...
## $ Gene.End..bp. : int 103358451 161852 721717 721717 139067 139067 129488399 129488399 229558695 65637439 ...
## $ Gene.description : chr "transcription elongation factor A like 9 [Source:HGNC Symbol;Acc:HGNC:30084]" "" "VPS53, GARP complex subunit [Source:HGNC Symbol;Acc:HGNC:25608]" "VPS53, GARP complex subunit [Source:HGNC Symbol;Acc:HGNC:25608]" ...
## $ Transcript.type : chr "protein_coding" "protein_coding" "protein_coding" "protein_coding" ...
## $ Protein.stable.ID : chr "ENSP00000361745" "ENSP00000481127" "ENSP00000401435" "ENSP00000401435" ...
## $ HGNC.symbol : chr "TCEAL9" "" "VPS53" "VPS53" ...## keep only annotated
X = X[rownames(Anno),]
PC = prcomp(t(X))
plot(PC$x[,1],PC$x[,2],pch=19+as.integer(Meta$Treatment)-1, col=as.integer(factor(Meta$Time)),cex=2)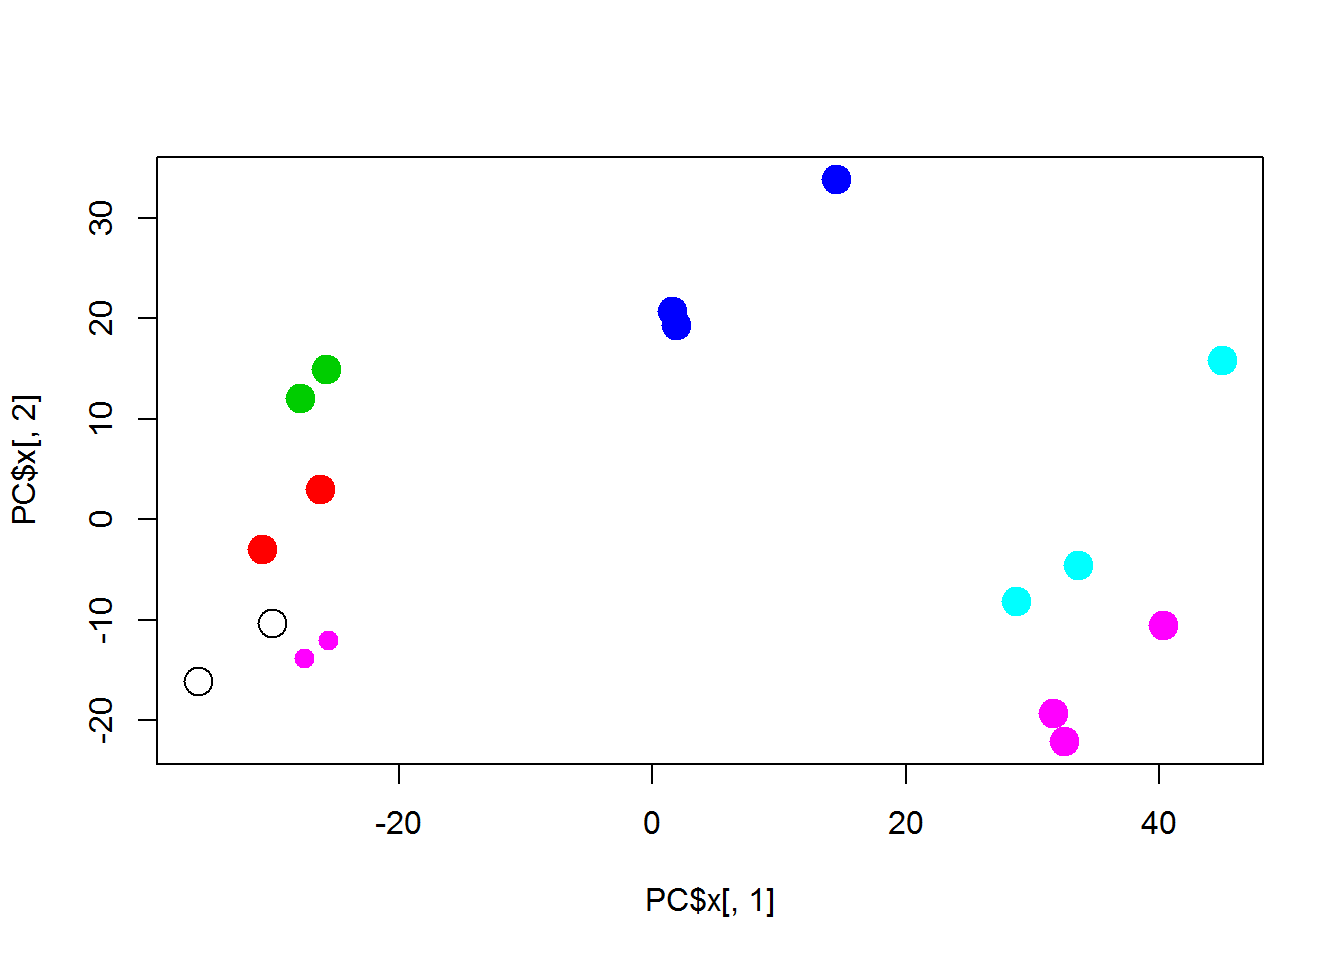
6.2. RNA-seq
rm(list=ls())
load("d:/data/LUSC60.RData")
str(LUSC)
## List of 5
## $ nsamples : num 60
## $ nfeatures: int 20531
## $ anno :'data.frame': 20531 obs. of 2 variables:
## ..$ gene : chr [1:20531] "?|100130426" "?|100133144" "?|100134869" "?|10357" ...
## ..$ location: chr [1:20531] "chr9:79791679-79792806:+" "chr15:82647286-82708202:+;chr15:83023773-83084727:+" "chr15:82647286-82707815:+;chr15:83023773-83084340:+" "chr20:56064083-56063450:-" ...
## $ meta :'data.frame': 60 obs. of 5 variables:
## ..$ id : chr [1:60] "NT.1" "NT.2" "NT.3" "NT.4" ...
## ..$ disease : chr [1:60] "LUSC" "LUSC" "LUSC" "LUSC" ...
## ..$ sample_type: chr [1:60] "NT" "NT" "NT" "NT" ...
## ..$ platform : chr [1:60] "ILLUMINA" "ILLUMINA" "ILLUMINA" "ILLUMINA" ...
## ..$ aliquot_id : chr [1:60] "a7309f60-5fb7-4cd9-90e8-54d850b4b241" "cabf7b00-4cb0-4873-a632-a5ffc72df2c8" "ee465ac7-c842-4337-8bd4-58fb49fce9bb" "6178dbb9-01d2-4ba3-8315-f2add186879a" ...
## $ counts : num [1:20531, 1:60] 0 3 13 272 1516 ...
## ..- attr(*, "dimnames")=List of 2
## .. ..$ : chr [1:20531] "?|100130426" "?|100133144" "?|100134869" "?|10357" ...
## .. ..$ : chr [1:60] "NT.1" "NT.2" "NT.3" "NT.4" ...#################################
## by warp-up
source("http://sablab.net/scripts/LibDEA.r")
library("DESeq2")## Loading required package: GenomicRanges## Loading required package: GenomeInfoDb## Loading required package: SummarizedExperimentres.DESeq = DEA.DESeq (count = LUSC$counts,
group = LUSC$meta$sample_type,
key0="NT",
key1="TP")## converting counts to integer mode## estimating size factors## estimating dispersions## gene-wise dispersion estimates## mean-dispersion relationship## final dispersion estimates## fitting model and testing## -- replacing outliers and refitting for 1695 genes
## -- DESeq argument 'minReplicatesForReplace' = 7
## -- original counts are preserved in counts(dds)## estimating dispersions## fitting model and testing##
## DESeq,unpaired: 12752 DEG (FDR<0.05), 11192 DEG (FDR<0.01)library("edgeR")
res.edgeR = DEA.edgeR (count = LUSC$counts,
group = LUSC$meta$sample_type,
key0="NT",
key1="TP") ##
## edgeR,unpaired: 12636 DEG (FDR<0.05), 10897 DEG (FDR<0.01)#################################
## manual
dge = DGEList(counts=LUSC$counts, group=as.factor(LUSC$meta$sample_type))
prior.df=10
dge = calcNormFactors(dge)
dge = estimateCommonDisp(dge)
dge = estimateTagwiseDisp(dge,prior.df=prior.df)
res= exactTest(dge)[[1]]
res$FDR=p.adjust(res$PValue,"fdr")
res = data.frame(id=rownames(LUSC$counts),res,stringsAsFactors=F)Exercise 6.2
Load an extract of 60 samples of TCGA on lung squamous cell carcinoma from http://edu.sablab.net/data/gz/LUSC60.RData – R binary (compressed) data file with raw count table and annotations
Investigate the data: PCA
Exclude genes which are never expressed (have 0 counts in all samples)
Apply edgeR and DESeq2 to detect differentially expressed genes b/w tumour and normal lung
Compare the results
Save significant genes to a text file
![]()